Yujin Kim,
PhD
Validation Assessment for CFD Predictions – Field Measurements
Field measurements were carried out to validate whether the outcomes of the CFD simulations agreed with physical reality. The verification and validation of the CFD results were assessed by considering three categories: a computational model, CFD code and simulation results. Verifying whether CFD code led to the accurate results was conducted through a sensitivity study. Validating whether CFD computational models provided the reliable simulation results was processed with field measurements by addressing research questions:
-
What is the appropriate methodology for the field measurements and analytical work to ascertain the credibility of the CFD simulation results that are correlated with physical reality?
-
What is the proper approach to the validation process to address the limitations of the three-dimensional models that do not have a high-level of detail of buildings, trees, people and cars?
-
What is the appropriate way to resolve the limitation of the distant weather station that provides the reference wind speed?
-
If differences (or errors) occur between the CFD results and the field measurements, how can these be arbitrated to establish reliable conclusions?
1. Introduction
To determine the times of the field measurements, the wind data of London were investigated. Several Met Office stations are located in London, but their locations are not close to the project sites (fig. 1). The London weather centre is the nearest to the site of interest, but the London weather centre’s measurements stopped in 2001 due to the poor quality of measurements from the rooftop site.[1]
2. Approach and Methodology of the Field Measurements
2.1. Measurement Time and Location
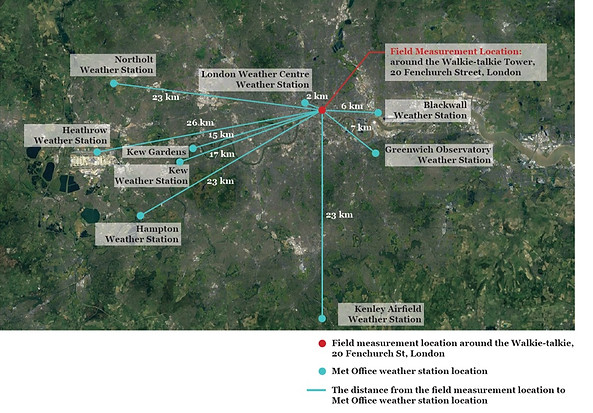
Fig. 1. Locations of the Met Office weather stations in London. (Source from CEDA Archives and background map from Google Earth Pro.)[2]
Other Met Office weather stations provide wind data for the duration, as shown in table 5.1 [3]. Four weather stations (Heathrow, Northolt, Kew Gardens and Kenley Airfield) have records of wind data up to the present. However, the City Lawson Criteria chosen for this study’s PLW comfort are based on the wind data from London Heathrow Airport (LHR) and London City Airport (LCY) [4]. Therefore, it is better to use wind data from LHR and LCY, rather than from the Northolt, Kew Gardens and Kenley Airfield. But the wind records of LCY from the Met Office are not open to the public, so wind logs from the LHR weather station were used for the present study.
To resolve the issues arising from the long distance between the project site and the LHR weather station, the trends of high and low wind speeds were cross compared from the LHR weather station, field measurements and CFD predictions (see section 3.1). Furthermore, the wind directions of LHR were compared with the field measurements at 162.1 m above ground level on site. Those were also compared with the wind directions from the CFD simulation results.
Note that some websites, including Wunderground [5], Meteoblue[6] and Weather Online [7], also provide wind data. However, they measure winds only once or twice per hour. As the City Lawson Criteria require mean wind speeds, the wind data from those websites were inappropriate for use.

TABLE 1. Duration of the wind data provided by the Met Office weather stations in London (Source: CEDA Archive, “Weather Data.”) [8]
Blocken (2012) stated that a steady RANS (Reynolds-averaged Navier-Strokes) model of the CFD produces fairly accurate results for an area where high-speed winds occur but not where low-speed winds occur [9]. The wind climate in London showed that the strong and frequent depressions (low pressure) generate the highest mean wind speeds in winter. The weather data in the CEDA Archives [10] showed the highest hourly-mean wind speeds occurred as 4.2 m/s at 10 m above ground level (25 m above mean sea level) of the LHR station (51.48 N, 0.45 W) in winter (December, January and February) from 1973 to 2020. Additionally, the investigation of wind data for the latest three years (2018 to 2020) shows the following [11]:
-
The hourly-mean wind speed in February was the fastest, at 5.0 m/s.
-
But, the hourly-mean wind speed in March (which is not in the winter season) was the second highest, at 4.8 m/s.
-
The hourly-mean wind speed in January was the third highest, at 4.4 m/s.
-
The hourly-mean wind speed in December was the fourth highest, at 4.2 m/s.
Because the mean wind speeds of the most recent years (from 2018 to 2020) are more relevant to the current wind speeds than those for the last 48 years, February and March 2022 were chosen for the field measurements for the present study. A total of 20 measurements of wind speeds were taken at 1.5 m above ground level for 10 days in February and March 2022 (refer to sections 2.2 and 2.3 for specific locations and times). As described above, the relatively faster hourly-mean wind speeds were shown from 4.2 m/s to 5.0 m/s for December, January, February and March during the latest three years (2018–2020), the measurement dates and times were chosen when the reference wind speeds at the LHR weather station were over 4.0 m/s.
The locations near 20 Fenchurch Street in the CoL were chosen for the measurements, as these are the critical areas where complaints about high-speed winds have risen since 2015 near the Walkie-talkie tower, according to the CoL [12]. To determine the measurement spots, a preliminary CFD simulation was undertaken, as shown in section 2.2.
A preliminary CFD simulation was carried out to decide the measurement spots of PLW speeds around 20 Fenchurch Street (fig. 5.2). The southwest wind was input at the inlet boundary condition, as it is the most prevailing wind direction in London throughout the year. The inlet wind profile was set up with the aerodynamic roughness length (Z0 is 2 m) [13] and reference height (Zref is 518 m) [14] with reference wind speed (Uref is 10 m/s). These conditions were the same CFD setups used in CFD simulations for this research. As shown in fig. 2, fast-moving flows occur at the northwest and southeast corners of the Walkie-talkie, and low-speed flows are generated at the north and southwest.
2.2. Preliminary CFD Simulation
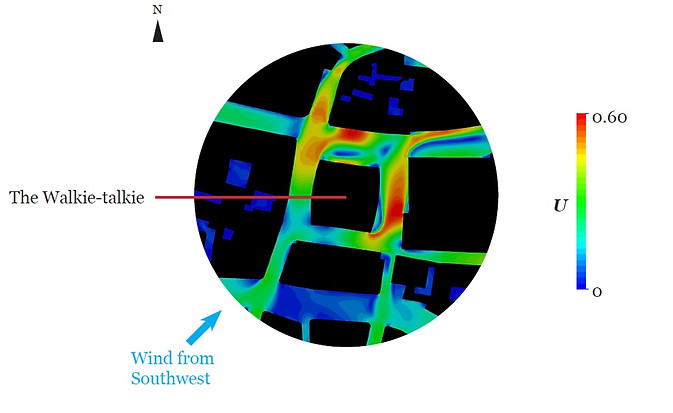
Fig. 2. Preliminary CFD simulation – wind speed ratio (U) at 1.5 m above ground level.
The computational three-dimensional models of the CFD did not have the same details as those in real life. As the present study focused on the building massing, not its details, the roofs and elevation designs of the buildings were simplified for the simulation model. Neither trees, vehicles nor people were included. Considering these limitations, the validation of the CFD simulation results was accomplished with wind patterns. Thus, it was assessed whether the locations of high and low-speed winds represented by the CFD correlate with those from the site of the field measurements.
The wind measurement spots were chosen as a set, composed of one spot with high-speed wind and another spot with low-speed wind. A total of two sets were selected (fig. 3). Set 1 consisted of spots A and B where slow- and fast-moving flows occurred, respectively. These were on the pedestrian pavements at the west and east side across from the Walkie-talkie tower. Set 2 was chosen with spots C and D because they were close to the main entrances at the north and south of the tower and it is critical to ensure PLW comfort near the building entrances. While the low-speed winds occurred near the north entrance (spot C), the fast-speed winds occurred close to the south entrance (spot D).
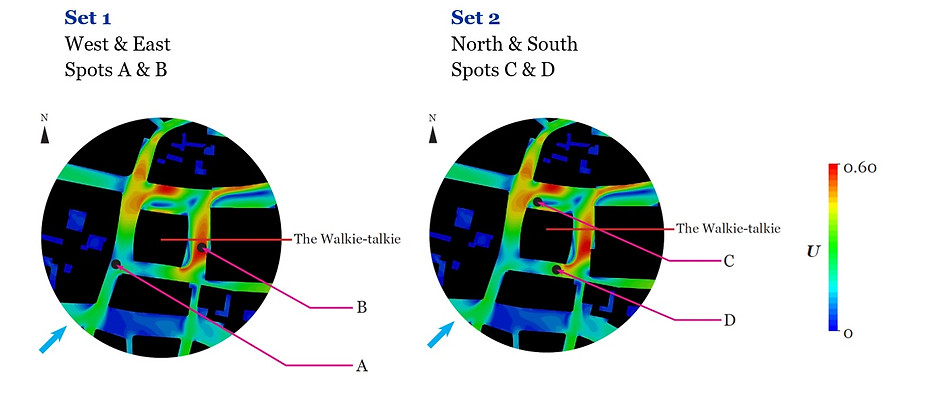
Fig. 3. Measurement spot sets 1 (left) and 2 (right).
The wind speeds at 1.5 m above ground level were measured at A, B, C and D by a mobile weather station. The detailed locations of A–D are shown in fig. 4 and 5. At the site, the locations of spots A–D were tape-measured to ensure that the mobile weather station was installed at the accurate locations.
Fig. 4. Measurement spot set 1: spots A and B.
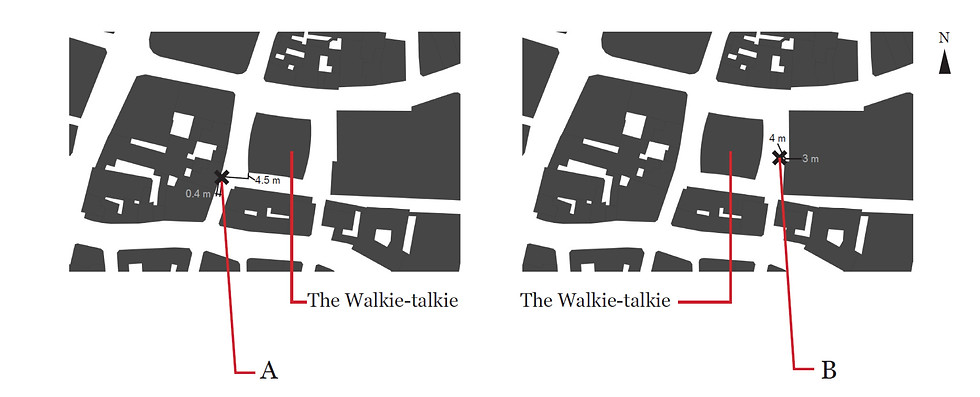
Fig. 5. Measurement spot set 2: spots C and D.

The DAVIS Vantage Vue mobile weather station was used to measure the wind speeds at 1.5 m above ground level at spots A, B, C and D. Fig. 6 shows the installation features of the mobile weather station at spots A, B, C and D. Spots A (west side of the Walkie-talkie tower) and B (east side of the tower) were located on the pavement across from the tower, and there is a car and bicycle road between the tower and the spots. Spots C (north side of the tower) and D (south side of the tower) were on the pavement near the tower entrances.
2.3. Field Measurements
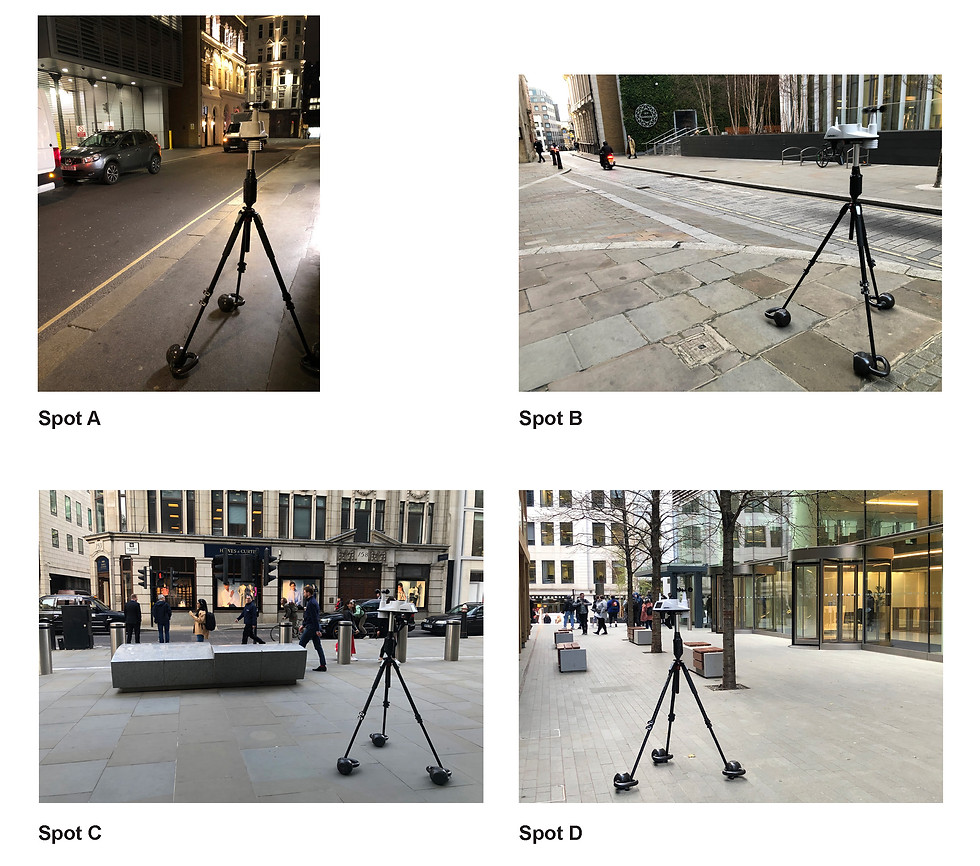
Fig. 6. Installation of the mobile weather station at spots A, B, C and D. (Photo by author.)
Field measurements were carried out with a mobile weather station to validate whether the CFD simulation results were in agreement with physical reality. When the simulations were implemented, a 3D digital model built in a simplified form was used. The field measurements also validated whether the models, focusing on building massing and not the details (e.g. canopies and roof shapes, etc.) could lead to results that were correlated with the real built environments.
The DAVIS Vantage Vue weather station 6250 [11] was used with the WeatherLink USB data Logger 6510 [12] and installed at 20 Fenchurch Street (Fig. 4.12), which was one of the project sites. Fig. 4.13–14 indicate the locations of the measurement spots. The wind speeds were measured in February and March 2022, as relatively high hourly-mean winds occurred in February–March during the last three years (2018–2020) [13]. Please refer to my PhD thesis for the installation features of the weather station and explanations of the field measurement setup.
Approach and Methodology
From February to March 2022, wind measurements were conducted on windy days (10 days total) and times (20 times total) when the hourly-mean reference wind speeds were greater than 4.0 m/s. An hour-long measurement was undertaken per spot, and measurements for two spots (in one set) were carried out for each day (table 2 and 3).
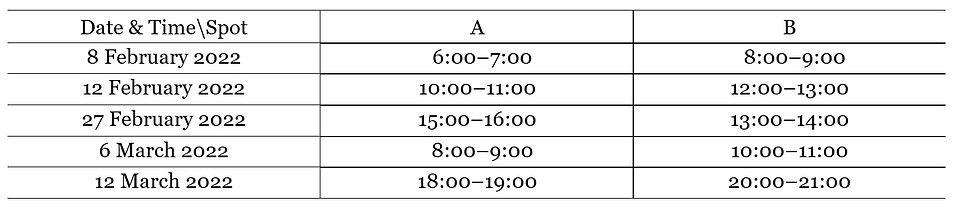
TABLE 2. Times and dates of the field measurements at spots A and B (set 1)
TABLE 3. Times and dates of the field measurements at spots C and D (set 2)
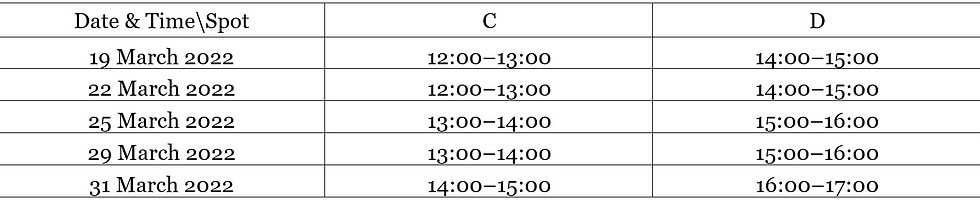
Note that due to the availability of only one mobile weather station, there was an hour gap between the measurements for each spot. For example, after measuring the winds at spot A from 6:00 to 7:00 on 8 February 2022, an hour was spent without measurements as the weather station was moved and installed at spot B. The measurement at spot B was carried out from 8:00 to 9:00 on the same day. Because of these measurement-time gaps, limitations in the validation process were expected when comparing the wind speeds between the field measurements and the CFD results. To resolve these limitations, the field measurements and CFD results were compared per spot, time and date together with the reference wind speeds at the LHR weather station (see section 3.1 – fig. 7 shown below).
The hourly-mean wind speeds in of the field measurements (Usite 1.5m) were compared with the hourly-mean CFD simulation results (Ucfd 1.5m) at 1.5 m above ground level at spots A, B, C and D, together with the hourly-mean reference wind speeds (Uref 10m) at 10 m above ground level at the LHR weather station. The City Lawson Criteria require mean wind speeds to assess wind comfort [15]. Lawson (2001) also asserted regarding a reference wind speed: “For wind loading studies this (reference wind speed) is always the Hourly-Average value of wind speed measured 10 m above flat open level ground” [16]. Thus, for this comparative analysis, the hourly-mean wind speeds were considered and cross compared throughout Usite 1.5m, Ucfd 1.5m and Uref 10m (fig. 7).
For the CFD simulations, the hourly-mean reference wind speeds (Uref 10m) from the LHR weather station were input as the inlet boundary condition. The reference wind data of the LHR weather station were obtained from the Met Office [17] and are indicated in fig. 7. The reference height (Zref) of the reference wind was 10 above ground level, and the roughness length (Z0) was 0.03 m [18]. Hence, the results from the CFD simulations represented hourly-mean wind speeds. The hourly-mean wind speeds at 1.5 above ground level from the CFD (Ucfd 1.5m) are shown in fig. 7.
3. Results
3.1. Comparison of Wind Speeds between Field Measurements and CFD Simulation Results
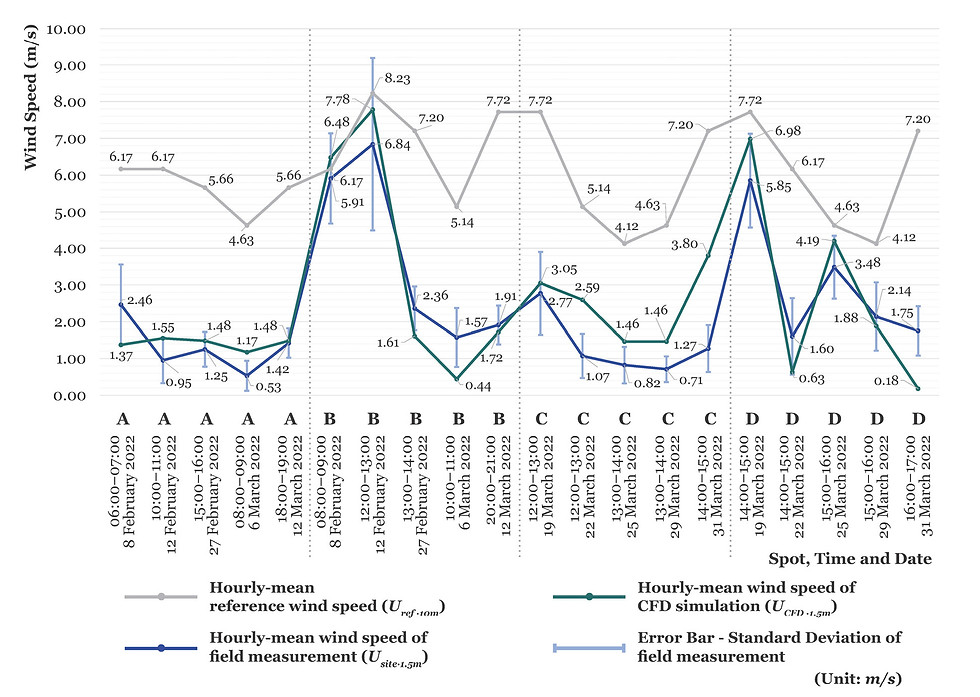
Fig. 7. Comparisons among hourly-mean wind speeds of the field measurements (Usite 1.5m), standard deviations of the field measurements, hourly-mean wind speeds of the CFD simulations (Ucfd 1.5m) and hourly-mean reference wind speeds (Uref 10m) at spots A, B, C and D
(unit: m/s).
As previously explained, to resolve the issue of the distant LHR Met Office, the wind speed patterns were cross compared from the LHR weather station, field measurements and CFD predictions. Additionally, the on-site wind speeds at 162.1 m above the ground level were obtained from the weather station, which belongs to 20 Fenchurch Street [19] and is installed at 2 m above the roof level of the Walkie-talkie tower.
Note that the wind speeds from the Walkie-talkie roof had low correlation with those of the LHR. This is because due to the convex shape of the roof, irregular pressure occurred near the surface of the roof. At the cuboid tower (the flat roof), lower pressure occurs at the edge of the roof adjacent to the windward façade, and a suction zone is generated. Soon, the pressure increases over the surface of the roof, and flow separation occurs. However, at the Walkie-talkie roof, irregular wind speeds occurred close to the roof surface because of the various angles of the convex-shaped roof. Therefore, the wind speed patterns from the Walkie-talkie roof are not correlated with those from the LHR weather station. For this reason, the wind speeds from the Walkie-talkie roof could not be used for the present study. It would have been better if the weather station were installed much higher than the 2 m above the roof, and if the freestream air were obtained.
However, this convex roof helped reduce the flow separation, and thus wind directions similar to the LHR showed from the Walkie-talkie roof. Therefore, only wind directions from 2 m above the roof of the Walkie-talkie were used for the present comparative analysis (see section 3.2). The LHR weather station was used for the reference wind speed for this validation assessment.
As shown in fig. 7, the trendlines of the field measurements, CFD simulation results and reference wind speeds in showed similar patterns. Overall, the reference wind speeds were higher than the wind speeds from the field measurements and CFD simulations. This is because the spots A–D are located in the CoL’s centre, so the winds were influenced by the urban built environment. Thus, the wind speeds at A–D from the field measurements and CFD simulations were overall lower than the reference wind speeds, which are measured in the open area (LHR weather station).
More importantly, the trend lines of the wind speeds from the field measurements and the CFD simulations show closely similar patterns with some differences. The explanations about those differences between CFD simulations and field measurements shown in fig. 7, are as follows:
1) Regarding the wind speeds at spot A, CFD overpredicted the wind speeds (four out of five measurements) compared to the wind speeds from the field measurements. Spot A is located where flows (from the southwest corner of the Walkie-talkie) are deflected on the west surrounding building (see fig. 9 in section 3.2). When the wind speed was 2.46 from 6:00 to 7:00 on 8 February 2022, the speed of the diverged winds was underestimated by the CFD simulation. But when the wind speeds of the deflected flows were lower than 2.46 for the other four measurements, CFD overestimated the wind speeds.
2) At spot C, the overall wind speeds from CFD simulations were higher than those of the field measurements. One of the possible reasons for the CFD’s higher wind speeds is the level of detail in the computational 3D model. As the present study focuses mainly on the overall massing shape of the building and its effects on PLW, the building canopy was not modelled. On site, the Walkie-talkie tower has a canopy at the north entrance, which spot C is close to (spot C is near the area underneath the canopy, not directly underneath). Consequently, the accelerated winds were blocked by the canopy at the site. However, in the CFD simulation without the building canopy, those high-speed winds reached the pedestrian level.
3) At spots B and D, when the relatively higher-speed winds occurred on site (greater than 2.36 m/s), CFD overestimated the wind speeds. In contrast, when the lower-speed winds occurred at spots B and D on site (lower than or equal to 2.36 m/s), CFD underestimated the wind speeds.
The high-speed winds (5.91 m/s and 6.84 m/s on site) reached spot B from the southeast corner of the Walkie-talkie from 8:00 to 9:00 on 8 February 2022 and from 12:00 to 13:00 on 12 February 2022, respectively. These high-speed winds were overestimated by the CFD.
At spot B, flow separations from the east surrounding building occurred from 13:00 to 14:00 on 27 February, 10:00 to 11:00 on 6 March and 20:00 to 21:00 on 12 March (see fig. 9 in section 3.2). The wind speeds from the flow separations were underestimated from the CFD. Thus, overall lower wind speeds were represented by the CFD on those three days.
Spot D is located at the channel between the concave surface of the Walkie-talkie and the south surrounding building (see fig. 10 in section 3.2). The wind speeds of 5.85 m/s and 3.48 m/s occurred on site from 14:00 to 15:00 on 19 March 2022 and 15:00 to 16:00 on 25 March 2022, respectively. These were relatively higher-speed winds than other measurements at spot D. When the streamlines near spot D were analysed for those times, flows moved to one direction (from east to west). With fast-moving winds, the CFD overpredicted the wind speeds.
However, the winds were deflected from the south surface of the Walkie-talkie, and the lower-speed winds of 1.60 m/s and 1.75 m/s occurred on site from 14:00 to 15:00 on 22 March 2022 and from 16:00 to 17:00 on 31 March 2022, respectively. These deflected and lower wind speeds were underestimated by the CFD.
Note that one-directional winds from southeast to northwest also occurred from 15:00 to 16:00 on 29 March 2022 with a wind speed of 2.14 m/s. In this case, CFD underestimated the wind speed as 1.88 . But the difference between the two were marginal, at 0.26 m/s.
4) When the wind speeds were relatively high at spots B and D from the field measurements at the times shown below, the wind speeds nearly reached the reference wind speeds:
-
At spot B from 08:00 to 09:00 on 8 February 2022
-
At spot B from 12:00 to 13:00 on 12 February 2022
-
At spot D from 14:00 to 15:00 on 19 March 2022
In summary, the above comparative analysis between the CFD results and field measurements shows the following:
-
Spots B and D are the regions where relatively higher-speed winds generally occur by the Walkie-talkie with the surroundings by London’s prevailing wind rose (the southwestern wind). In these areas, when the high-speed winds occurred, CFD overestimated the wind speeds.
When the flow separations caused relatively lower-speed winds at spot B, CFD underestimated the wind speeds. When the flows were deflected at spot D, CFD also underpredicted the wind speeds.
-
However, in spot A, relatively lower-speed winds are generally induced by the Walkie-talkie with the surroundings by London’s prevailing wind rose (the southwestern wind). In this area, when the flows were deflected and the low-speed winds were generated, CFD overpredicted the wind speeds.
-
The level of detail in the 3D computational model of the CFD could affect the results. The winds were accelerated without the building canopy model in the CFD simulation. Nonetheless, similar trend lines of the wind speeds were shown between the CFD and the field measurements. Therefore, the results from the CFD were acceptable for the purpose of this comparative study: to validate the wind speed patterns from the CFD, compared to the physical reality.
To consider the errors of the field measurements, possible errors were calculated with the equation (1), and they were represented by error bars (fig. 7 and table 4):
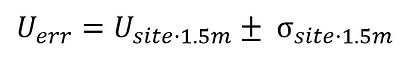
(1)
where Uerr, Usite 1.5m and σsite 1.5m are the possible errors, hourly-average wind speeds and standard deviations of the field measurements, respectively. The DAVIS Vantage Vue mobile weather station measured the wind speed every 2.5 to 3.0 seconds, but the average value per minute was recorded to the data logger. Thus, a total of 60 measurement data per hour were obtained. The average wind speeds (Usite 1.5m) and standard deviations (σsite 1.5m) are the values from the 60-measurement data per hour.
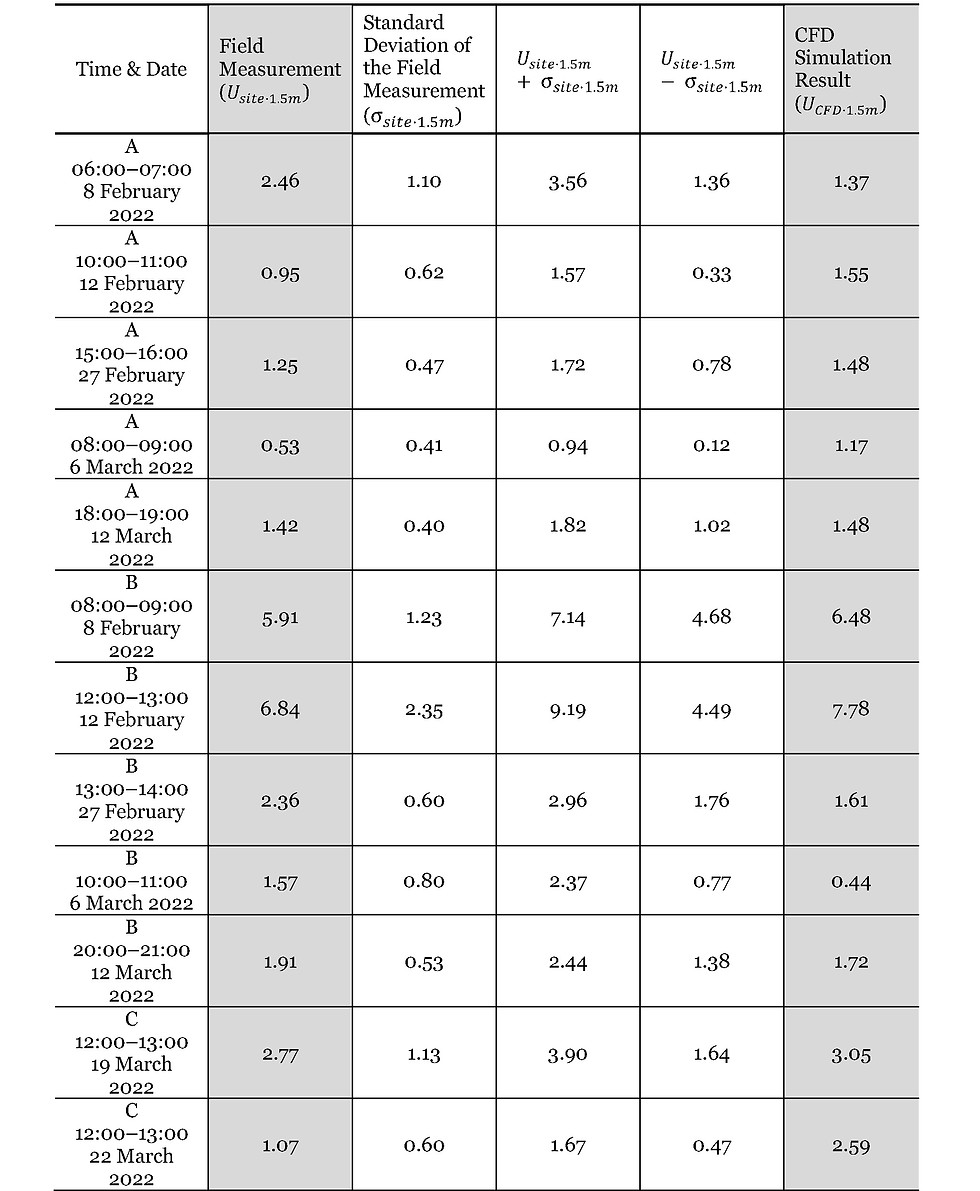
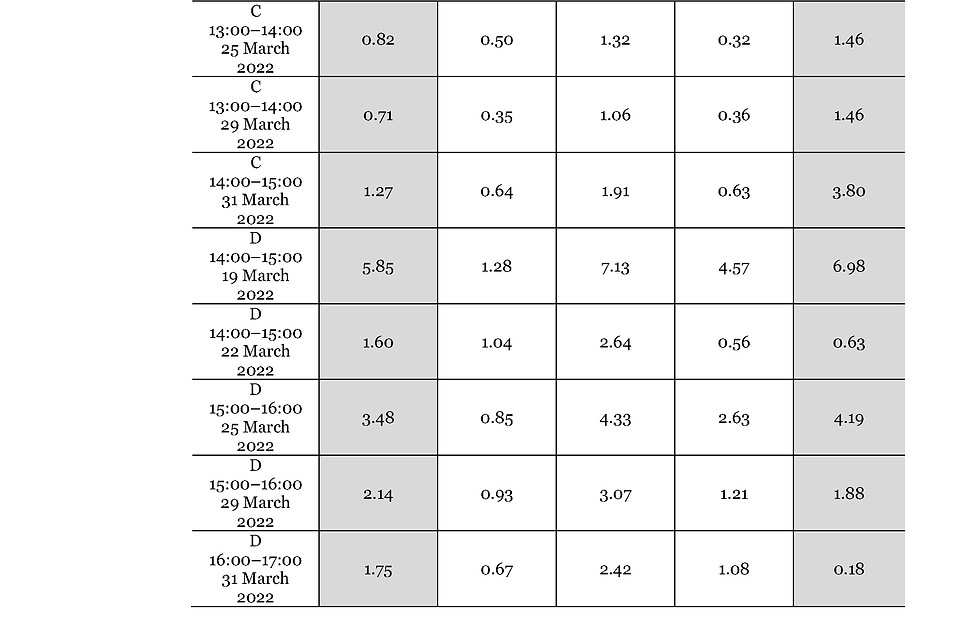
TABLE 4. Hourly-average wind speeds (Usite 1.5m) and standard deviations (σsite 1.5m), error ranges (Usite 1.5m +- σsite 1.5m) of the field measurements and CFD simulation results (Ucfd 1.5m) [unit: m/s]
In most cases, at spots A, B and D, the wind speed predictions by CFD are within the error ranges of the field measurements with some exceptions. The explanations are as follows:
-
Spot A: Four measurements out of five were within the error ranges. One measurement was out of the error range, but the difference is insignificant as shown below:
08:00–09:00 6 March 2022: 0.23 difference from the error bar
-
Spot B: Three measurements out of five were within the ranges of the errors. Two were out of the error ranges, but the differences are marginal as shown below:
13:00–14:00 27 February 2022: 0.15 difference from the error bar
10:00–11:00 6 March 2022: 0.33 difference from the error bar
-
Spot D: Four measurements out of five were within the error ranges. One measurement was out of the error range, but the difference is less than 1 :
16:00–17:00 31 March 2022: 0.9 difference from the error bar
At spot C, four measurements out of five were out of the error ranges. The wind speeds were overestimated by the CFD:
-
Spot C:
12:00–13:00 22 March 2022: 0.92 difference from the error bar
13:00–14:00 25 March 2022: 0.14 difference from the error bar
13:00–14:00 29 March 2022: 0.40 difference from the error bar
14:00–15:00 31 March 2022: 1.89 difference from the error bar
As described previously, with the building canopy absent from the computational model, CFD predicted higher wind speeds than the field measurements. In three cases out of five, the differences from the error bar of the field measurements at spot C were less than 1 . But from 14:00 to 15:00 on 31 March 2022, the difference was highest, at 1.89 . This was because the reference winds approached from the north, and the flows were directly down to the pedestrian level by the concave north façade of the Walkie-talkie (see fig. 5.10 in section 5.3.2). The accelerated winds from the northeast side also affected spot C. Without accounting for the canopy, the CFD simulation overpredicted the wind speeds.
Moreover, it should be noted that the measurement accuracy of the DAVIS Vantage Vue weather station is . However, of the measurement results are within the error ranges for each result of spots A–D (see fig. 5.7 for the error bars and table 5.4 for the error ranges). Therefore, the accuracy issues of the weather station have already been considered.
Therefore, considering the error ranges of the field measurements together with the limitation of the level of detail in the computational model, most CFD results were within the error ranges. Although some CFD outcomes were out of the error bars, their differences from the error ranges are insignificant. Thus, the wind speeds from the CFD predictions are acceptable overall in comparison to the physical reality.
To validate whether CFD simulations can predict wind directions that are in agreement with the physical reality in addition to the wind speeds, the wind directions from the CFD results were cross compared with those of the field measurements together with the reference wind directions. As the reference wind directions were obtained from the LHR Met Office, which is located at the long distance (about 26 ) from the project site, wind directions at 162.1 above ground level on site (refer to appendix E – E.4) were also compared to ensure that the reference wind direction was maintained until the project site. Fig. 8 describes what the comparison charts in fig. 9 and fig. 10 represent. Fig. 9 shows the comparison results of wind directions at spots A and B. Fig. 10 shows the results of spots C and D. Note that the weather data with 36 wind directions (10 ° increments) of the reference winds at LHR and 16 wind directions (22.5 ° increments) of the mobile weather station were converted into eight wind directions (45 ° increments). The average values of wind data from the Walkie-talkie roof’s weather station () were recorded every 15 minutes (four times per hour). The wind data from the field measurements () were measured every 2.5 to 3.0 seconds. The mean speeds and the dominant directions of winds per minute were recorded to a data logger. The prevailing wind directions are indicated in fig. 9 and fig. 10 with the occurrence percentage (%) of the recorded wind roses. The wind directions of the reference () and CFD results (and ) are the hourly-mean values.
3.2. Comparison of Wind Directions between Field Measurements and CFD Simulation Results
FIGURE 8. Explanations of figures 9 and 10.
As shown in fig. 8, at the top of the comparison chart, spots A–D of the CFD simulation result () and field measurement () at 1.5 above ground level were indicated. The time and date of the results are shown at the upper and left sides of the chart. The CFD simulation result with wind speed contours is shown in the middle. The wind directions of the reference () and the CFD result () at each spot are indicated together with wind speeds in from the CFD simulation and field measurement. At the bottom of the chart, the CFD result () and field measurement () at 1.5 above ground level were represented. The reference wind direction () at 10 above ground level at Met Office is indicated to be the same as the wind direction at the inlet boundary condition of the CFD simulation. Then, the wind direction measured at 162.1 above ground level (), is indicated together with the wind direction from CFD simulation result at 162.1 above ground level ().
The results from the comparative analysis of wind directions of spots A and B are shown below in fig. 9.
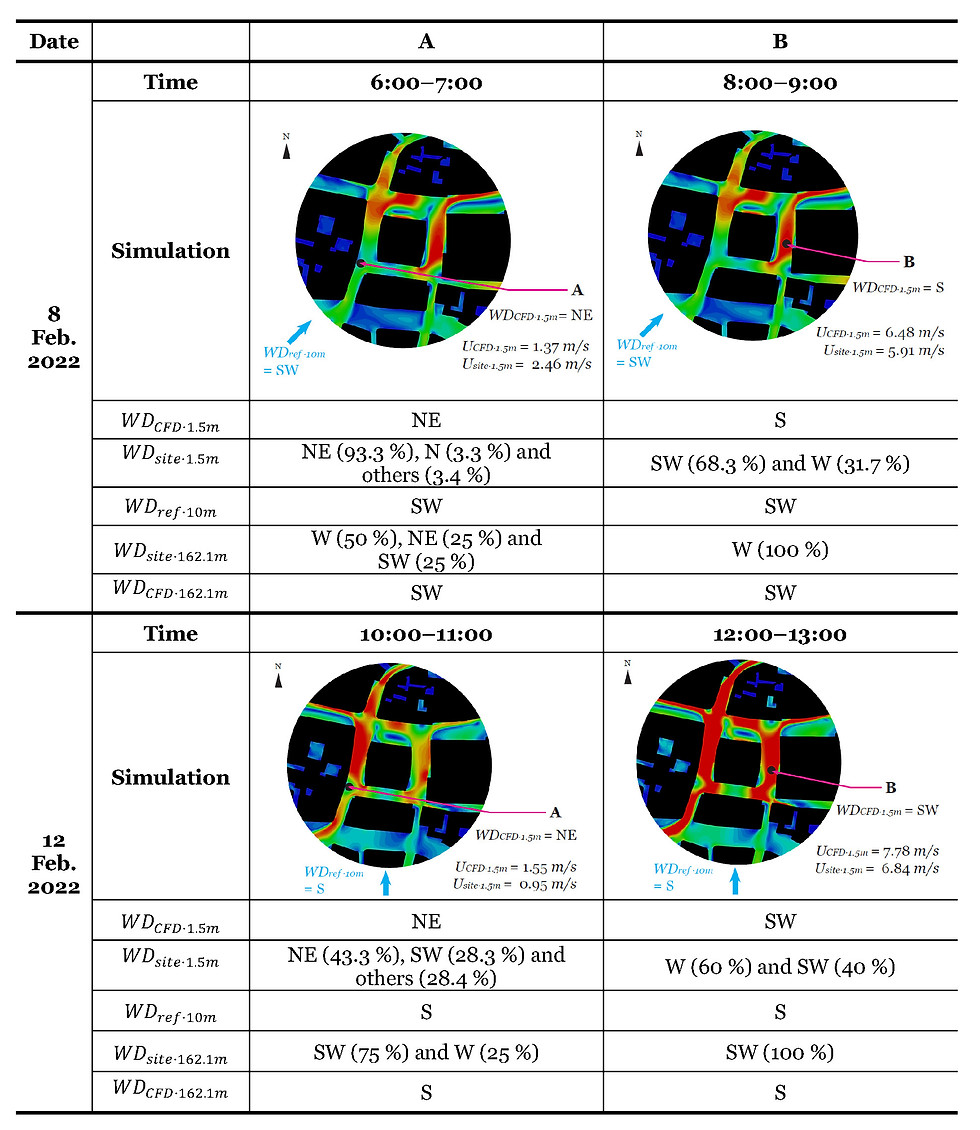
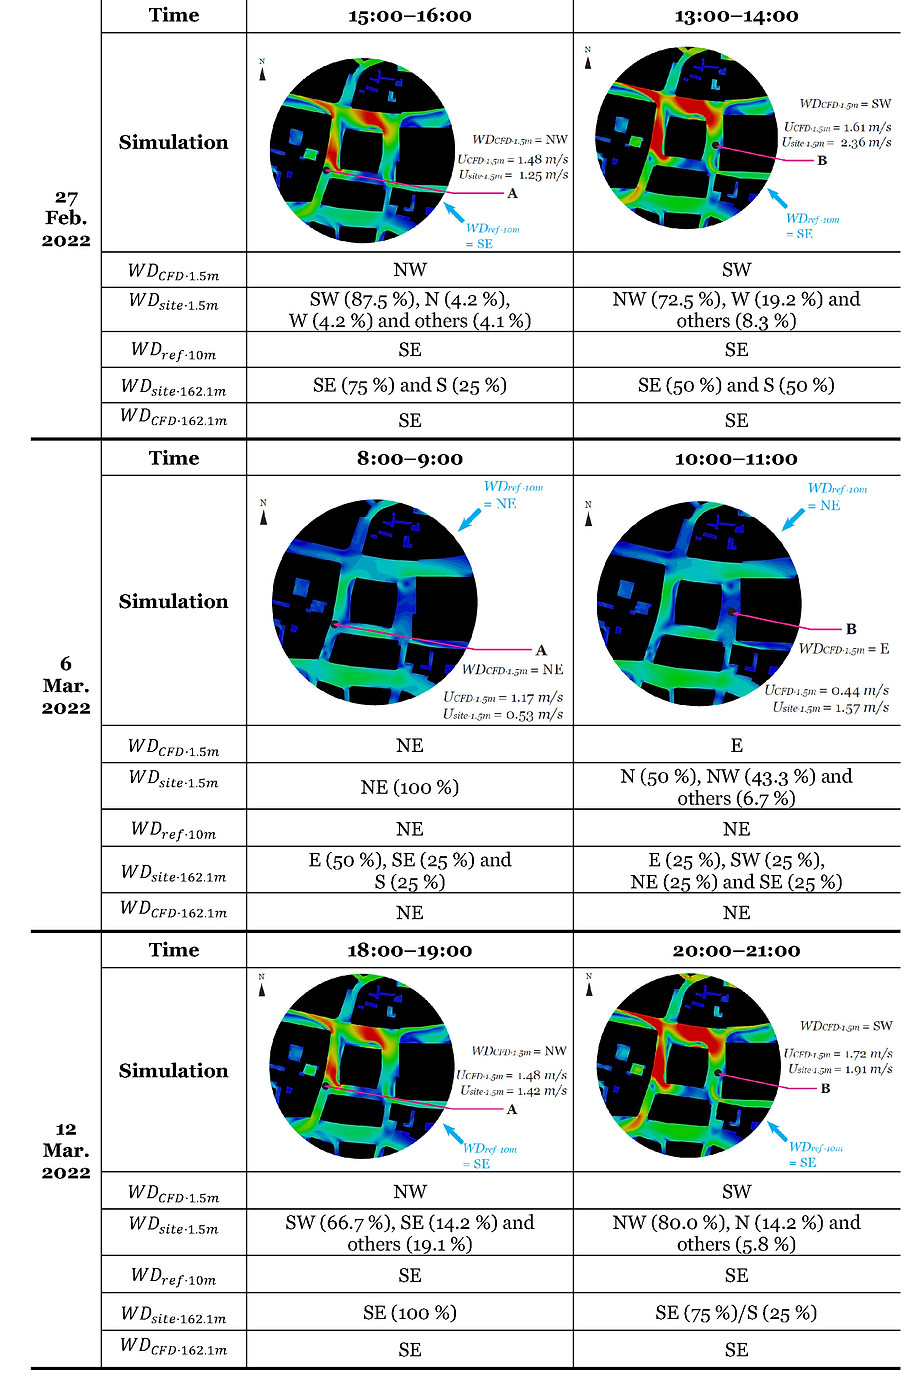
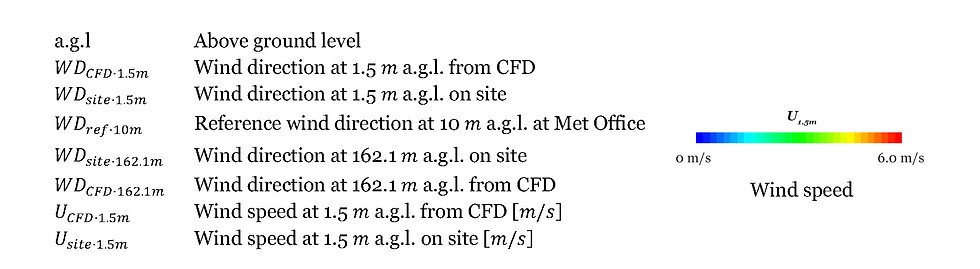
FIGURE 9. Comparisons of wind directions at spots A and B of the CFD simulations to field measurements.
The comparison results at spots C and D are represented below in fig. 10.
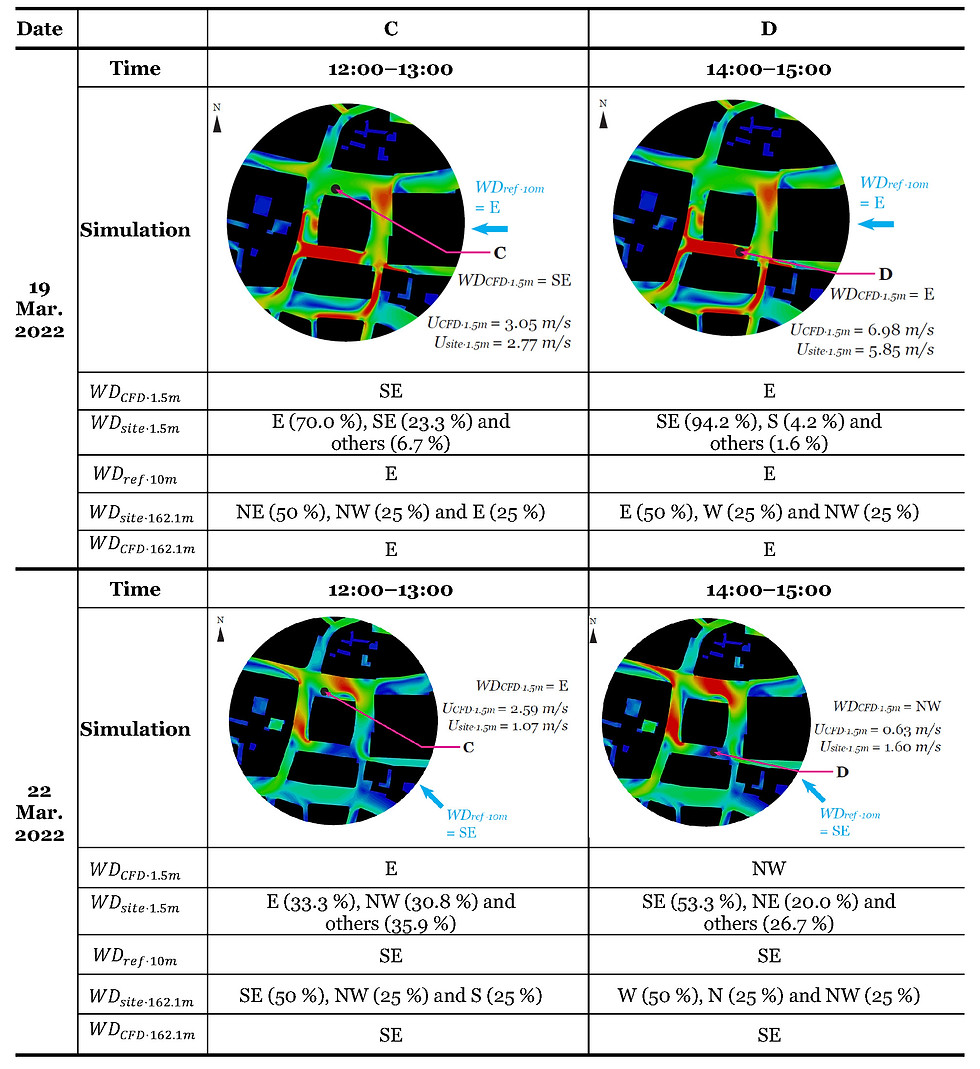

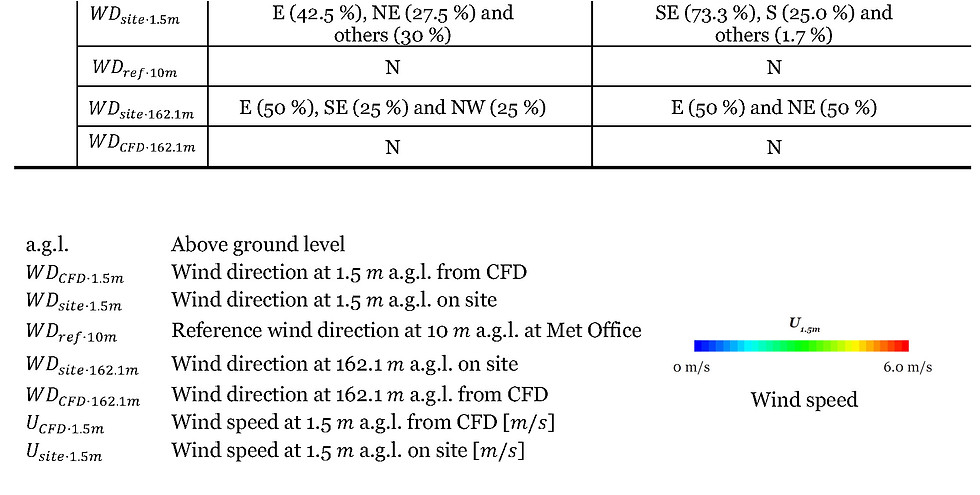
FIGURE 10. Comparisons of wind directions at spots C and D of the CFD simulations to field measurements.
The wind directions from the CFD simulation at 162.1 above ground level () were the same as the reference wind directions (). This means that because the reference wind directions were input at the inlet of the CFD, they were maintained until the incident locations (the Walkie-talkie tower = ). The wind directions measured above the roof of the Walkie-talkie tower on site (), were overall similar to those of the reference wind and CFD results ( and ), with some exceptions. Because the weather station was located only 2 above the roof of the Walkie-talkie, it was possible that the airflows were influenced by the roof geometry, and those exceptions might occur. A location higher than 2 above the roof would have provided more accurate wind directions for freestream air. Moreover, the Walkie-talkie tower is located about 26 from the LHR weather station, and the long distance could result in those differences. Nonetheless, overall acceptable agreements were obtained for the wind directions among CFD predictions (), reference wind directions () and field measurements at 162.1 above ground level (). Therefore, despite the limitation of the long distance between the project site and the LHR weather station, the inflow air directions for the project site in the CFD simulations are acceptable. By comparing the wind directions of CFD simulations () with those of field measurements () at 1.5 above ground level, the agreements and disagreements from the two results were obtained as shown in table 5 for spots A/B and table 5.6 for spots C/D. How the agreements/disagreements are indicated is detailed below. Additionally, wind speeds of CFD results and the field measurements were represented to see whether there is a relationship between the agreement/disagreement of wind directions and wind speeds of the two.
-
When the wind directions between the CFD result and field measurement were the same, ‘O’ represents the agreement.
-
When the wind direction from the CFD simulation was the same as the wind direction with the second high percentage (%) from the field measurement, it was represented as agreement (O).
-
When the wind directions between the two were similar, it was marked as ‘Δ’.
(e.g. The wind direction of the CFD simulation was south but that of the field measurement was southwest.)
-
When the results between the two were different, it was represented by ‘X’.

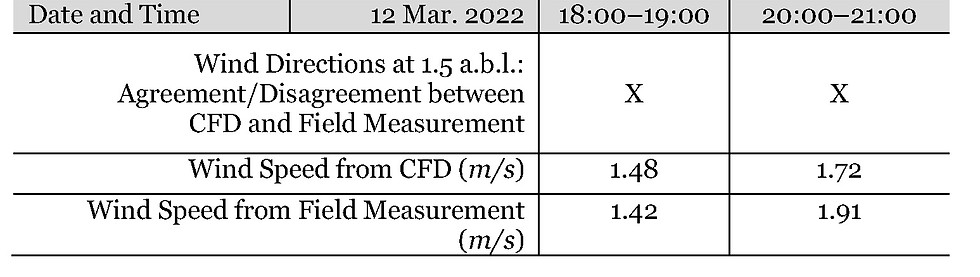
TABLE 5. Agreements/disagreements of the wind directions between CFD results and field measurements at 1.5 above ground level of spots A and B, and the wind speeds between the two.
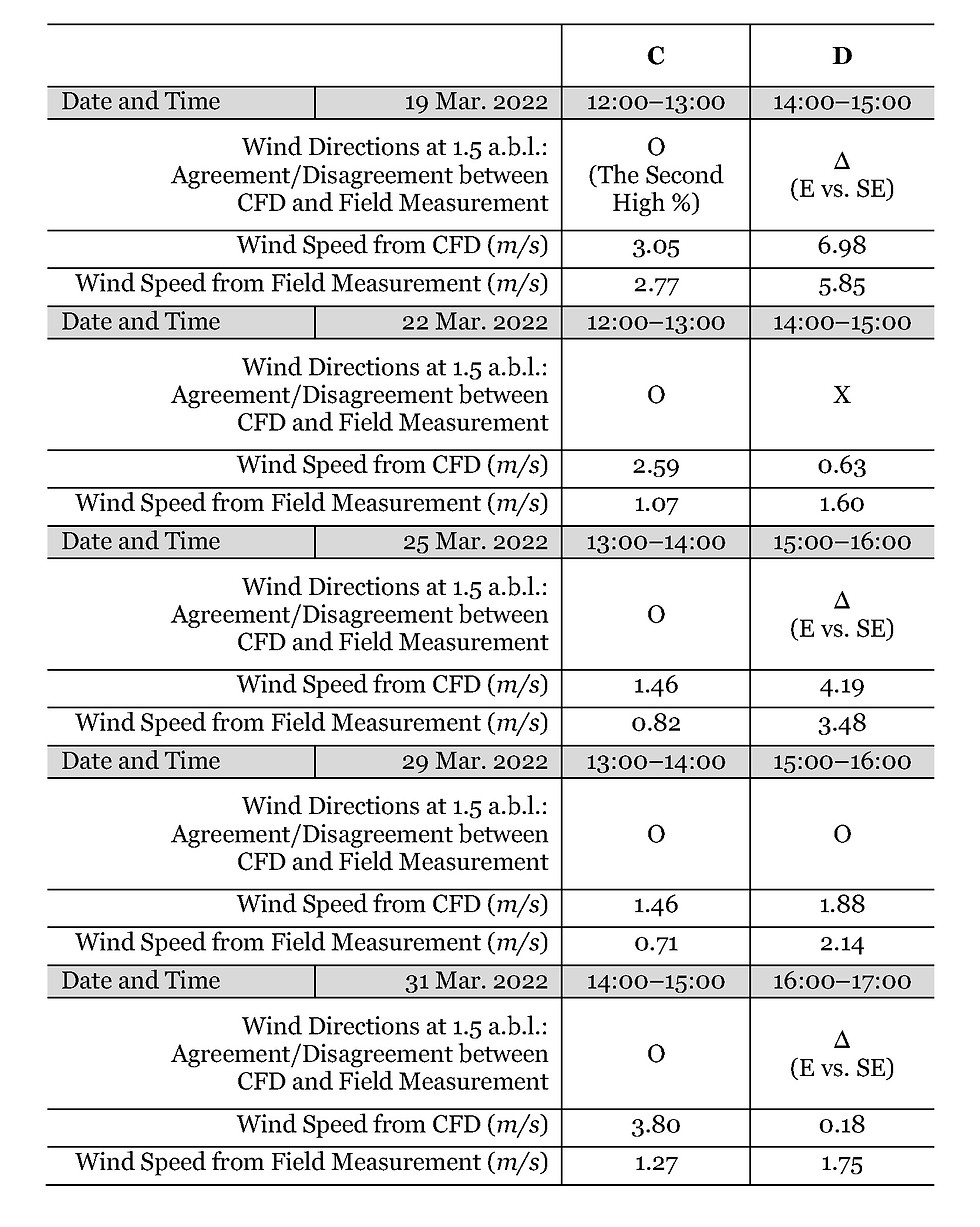
TABLE 6. Agreements/disagreements of the wind directions between CFD results and field measurements at 1.5 above ground level of spots C and D, and the wind speeds between the two.
For each spot, the percentage (%) of disagreement (X) is as shown in table 7. The highest disagreements were resulted at spot B. When spot B’s wind patterns in CFD simulations in fig. 5.9 (and additionally with the streamlines) were analysed, the relatively high-speed winds occurred from 8:00 to 9:00 on 8 February 2022 and from 12:00 to 13:00 on 12 February 2022. Thus, at spot B, the flow separations did not occur, and the wind directions from the CFD simulations and field measurements were similar.

TABLE 7. Disagreement percentage (%) between CFD results and field measurements at 1.5 above ground level for spots A–D
However, when the reference winds approached from the SE from 13:00 to 14:00 on 27 February 2022 and from 20:00 to 21:00 on 12 March 2022, the flow separations occurred from the corner of the east surrounding building. The CFD underestimated the deviation of the flow separations. The distances of the flow separations were represented in a shorter length from the east surrounding building’s corner. Therefore, the flow separations did not reach spot B, and this caused the disagreements between the CFD and field measurement. From 10:00 to 11:00 on 6 March 2022, the flow separation was also underestimated by CFD at the north side of spot B. Thus, this caused disagreement of the CFD’s wind direction with the field measurement.
At spot C, the highest percentage (%) of the agreement was obtained for the wind directions at 1.5 above ground level between the CFD results and field measurements. When the CFD wind patterns for spot C were analysed shown in fig. 5.10 (and additionally with the streamlines), the flow separations were not generated at spot C on 19, 25, 29 and 31 March 2022. On 22 March 2022, the flows were deflected at the south side of spot C, but this did not affect spot C. Thus, overall good agreements were shown between the CFD and field measurements.
From analysing spot A’s wind patterns by CFD simulations (fig. 5.9 and additionally with the streamlines), it is shown that the flows from the southwest corner of the Walkie-talkie were deflected by the surfaces of the west surrounding building. Hence, at spot A, the flows were diverged to the north and south sides on 8, 12 and 27 February 2022 and 12 March 2022. The conditions of the wind direction changes caused both the agreements and disagreements between the CFD results and the field measurements. On 6 March 2022, the flows were moving only to the south, and the agreement of wind direction were shown between the two tools.
Spot D is located at the channel between the concave surface of the Walkie-talkie and the south surrounding building. When the wind patterns by CFD were investigated (fig. 5.10 and additionally with the streamlines), overall flows moved to one direction at spot D on 19, 25 and 29 March 2022. In these cases, the wind directions from the CFD were similar to those from the field measurement. On 22 March 2022, the flows were deflected on the south surface of the Walkie-talkie from the southeast wind direction of the reference wind. Thus, the disagreement occurred between the two tools. On 31 March 2022, the reference winds were approached from the north. Hence, the wake area was generated at the channel of the south side of the Walkie-talkie. The flows from the south surface of the Walkie-talkie were slightly deflected, and agreements occurred between the two tools.
Therefore, the flow separations and deflections had influence on the agreements/disagreements of the wind directions between the CFD results and the field measurements. When the flow separation occurred or when the winds were deflected on the surfaces of the building, the CFD predictions of the wind directions were in disagreement with those of the field measurements. But when the flows were slightly separated or deflected, agreements were shown.
It should be noted that there was a limitation to scrutinise the relationship between the wind speeds and agreements/disagreements of wind direction at 1.5 above ground level from the CFD predictions and field measurements. (e.g. It is difficult to verify whether the low wind speeds cause more disagreements, or the high wind speeds result in more agreements.) This is because the freestream wind speeds on site could not be obtained. If they were achieved, they could be used as the reference wind speeds, and the wind speed ratio () could be calculated. The wind speed ratio from the CFD and field measurements could have been compared.
However, as previously explained, the wind speeds measured at 162.1 above ground level (2 above the Walkie-talkie roof level) on site were not correlated with the reference wind speeds at the LHR weather station. This is because the various angles of the convex roof changed the wind speeds, and the weather station is installed at 2 above the Walkie-talkie roof level, which is not enough height to get freestream air. Thus, only wind directions from the roof were used as those were correlated with the wind directions from the LHR weather station. And without the freestream wind speeds at the project site, there was a limitation to discover how the wind speeds affect the wind direction at 1.5 above ground level.
Nonetheless, for this study, wind speeds from the LHR weather station were used as the reference wind speeds, and they were input for the inlet boundary condition of the CFD. To resolve the issue of the distant location of the LHR weather station, the patterns of the wind speeds were cross compared from the LHR weather station, CFD predictions and field measurements (previously shown in fig. 5.7). The results showed the sufficient correlations among the three. Moreover, the comparative analysis of the frequency (%) of occurrences for wind directions (tables 5.5–5.7) validated the accuracy of the CFD predictions compared to the physical reality.
Validation of the wind speeds and directions from the CFD simulations was performed with the field measurements using the mobile weather station around 20 Fenchurch Street, London. From the comparative analysis of the wind speeds between the CFD simulation and the field measurement together with the reference wind speeds, the results were as follows:
1) At the regions (spots B and D) where the relatively high-speed winds occurred by the Walkie-talkie and the surroundings from London’s prevailing wind rose (the southwest wind), CFD overestimated the high-speed winds. However, when the flow separations and deflections were generated, CFD underestimated the wind speeds.
2) At the region (spot A) where relatively low-speed winds were induced by the Walkie-talkie and the surroundings from London’s southwestern winds (the most prevailing wind direction), CFD tended to overpredict the low wind speeds caused by the flow deflections.
3) Although the low level of detail in the computational model caused the wind speed differences between CFD simulations and field measurements, similar wind patterns were shown between the two.
4) Considering the possible error ranges with the standard deviations of the field measurements, the CFD predictions of the wind speeds provided good agreements with the field measurements.
From the comparisons of the wind directions between CFD and field measurements, the results are as follows:
1) The flow separations and deflections are some factors that resulted in disagreements in the wind directions between CFD results and field measurements. CFD tended to underpredict the deviations of the flow separation. Although the marginal flow separation and deflection cause less disagreements in the wind directions between the two, they are still the one of the reasons that caused the different predictions of wind directions by the CFD. When wind speeds were relatively high on site, the flow separations would not occur, and thus, agreement of wind directions between the two tools could be obtained.
2) When comparing the wind directions between the LHR weather station and 162.1 above ground level at the project site (by both CFD and on-site measurements), similar wind directions were shown. This means that the wind directions used for the inflow air in the CFD and the wind directions at the incident location (2 above the roof level of the Walkie-talkie) of the CFD were in agreement with the aerodynamic conditions on site.
3) The CFD can be used to predict wind directions as well, particularly at a region where the flows are mainly moving one direction. At areas where strong flow separations and deflections occur, the CFD has limitations in estimating the wind directions.
Further analysis could have been performed to scrutinise the reasons for the differences between the CFD predictions and field measurements. However, the main purpose of the current study is to examine the effects of tall building geometries on PLW comfort. These field measurements were carried out to validate the credibility of the CFD results in comparison to the physical reality. Therefore, the validation assessment provided in this chapter has achieved the sufficient agreements for the object of this study. Further detailed analysis of the field measurements could be undertaken for the future study.
(Excerpt from my PhD thesis, 'Geometries of Tall Buildings Improving Wind Comfort in London.')
4. Conclusions
[1] Duncan Ball (information specialist at the Met Office), Email message to author, May 7, 2022.
[2] Source: Locations of weather stations from “Weather Data in CEDA Archives,” CEDA Archive, Last modified January 3, 2021,
https://help.ceda.ac.uk/article/96-weather-data;
Background map from Google Earth Pro, accessed April 20, 2022,
https://earth.google.com/web/.
[3] CEDA Archive, “Weather Data.”
[4] City of London and RWDI, “Wind Microclimate Guidelines”.
[5] “WU Weather Underground,” WU Weather Underground, accessed April 24, 2022,
https://www.wunderground.com/.
[6] “Meteoblue Weather Close to You”, Meteoblue, accessed April 24, 2022,
https://www.meteoblue.com/en/weather/week/london_united-kingdom_2643743.
[7] “Weather Online,” Weather Online, accessed April 24, 2022,
https://www.weatheronline.co.uk/.
[8] Source: Data from CEDA Archive, “Weather Data.”
[9] Blocken, Janssen, and van Hooff, “CFD Simulation,” 31.
[10] CEDA Archive, “Weather Data.”
[11] Ibid.
[12] Baker and Mclelland, “Windy City!,”.
[13] Wieringa, “Updating the Davenport,” 366.
[14] Davenport, “Wind Structure to Wind Loading,” 86.
[15] “City of London and RWDI, “Wind Microclimate Guidelines.”
[16] Lawson, Building Aerodynamics, 24.
[17] Duncan Ball (information specialist at the Met Office), Email message to author, April 13, 2022.
[18] Wieringa, “Updating the Davenport,” 366.
[19] Phil Jones (technical services manager of 20 Fenchurch Street, London), Data transferred to author and email message to author, March 4, 2022 and April 13, 2022.