Yujin Kim,
PhD
Building Performance Assessment from
Comparison between the Isolated (Pure Aerodynamic) and
London’s Urban Conditions
To assess a tall building performance in London’s built environments, a comparative analysis was undertaken between an isolated (pure aerodynamic) condition and London’s urban built environments. With this new approach, aerodynamic interactions between tall building geometries and neighbouring urban morphologies could be understood better.
Quantitative and Qualitative Analysis in
Isolated Building Condition
Methodology
After analysing the geometries of London’s tall buildings [7], a total of 38 geometries were tested using OpenFOAM CFD software. Please refer to the CFD code I wrote in C++ at:
https://github.com/cfdcode.
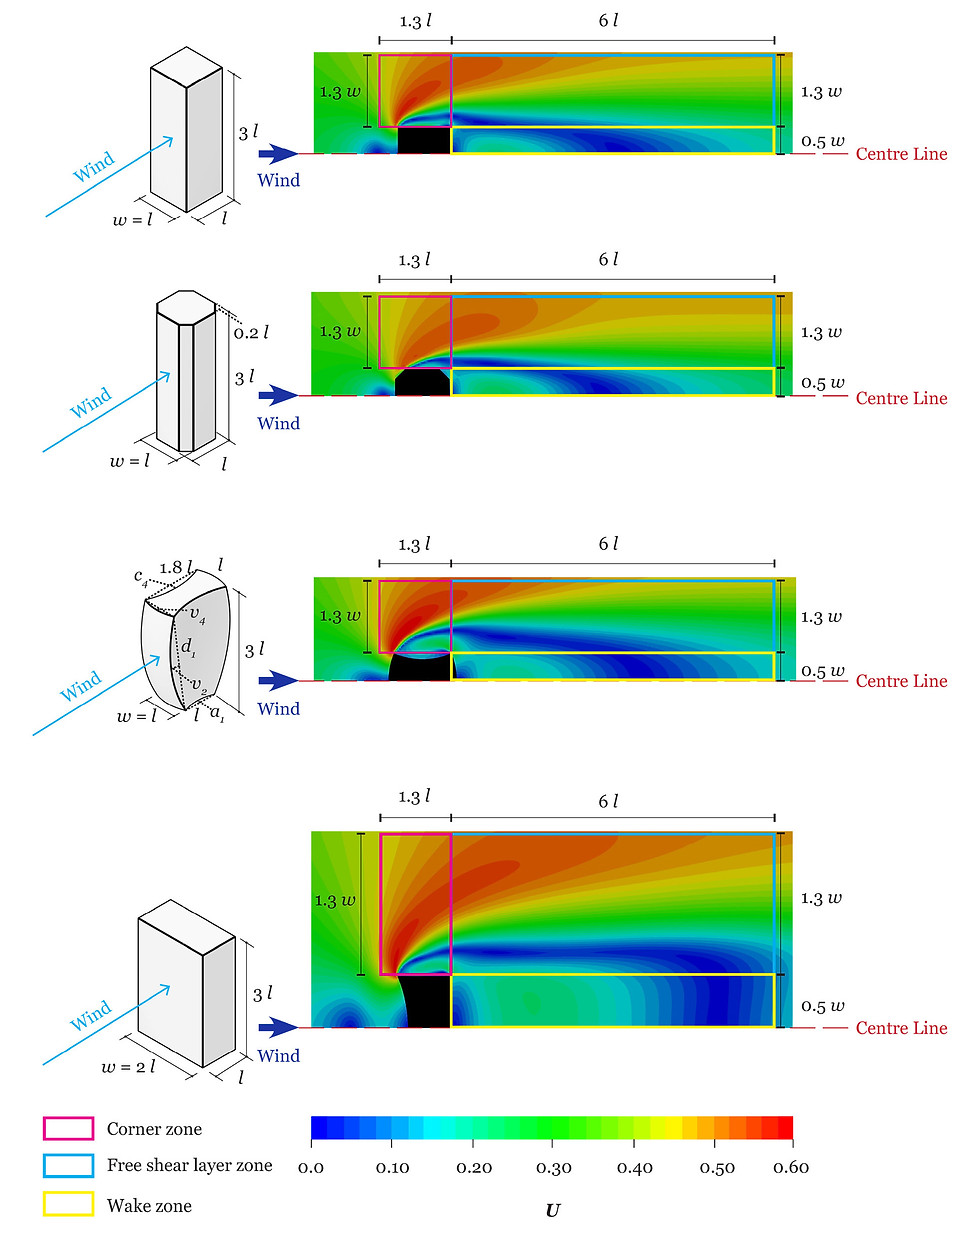
To analyse building performance quantitatively, three zones were categorised – corner, free shear layer and wake zone (Fig. 4.3). The wind speed ratio of each building geometry was quantified based on these zones. Using a bespoke ranking system created during my PhD, building performance was ranked. A higher ranking represents that a building performs better by reducing PLW speed ratio, which can eventually improve PLW comfort. A lower ranking indicates the opposite results. Please refer to my PhD thesis for details at:
Fig. 4.3. Analysis zones for wind speed ratios at 1.5 m above ground level – corner, free shear layer and wake zone [8]
Results – Quantitative Analysis
Using a bespoke ranking system, a total of four analyses were undertaken, using three zones (previously shown in Fig. 4.3) and three criteria – average wind speed ratio (Uave), area above the wind speed ratio that exceeds the average wind speed ratio (Uabv, hereinafter ‘area above average wind speed ratio) and maximum wind speed ratio (Umax). The purpose of creating and using these three criteria was to quantify the impact of a building form on winds at the pedestrian level. From the comparative analysis of the 38 geometries, which building form performs better (reducing PLW speed ratios) than other geometries was assessed.
During the analyses, the wind speed ratios were normalised per criteria (Equations 4.3–5) to compare the performances of the 38 buildings as percentages (refer to my PhD thesis for details):
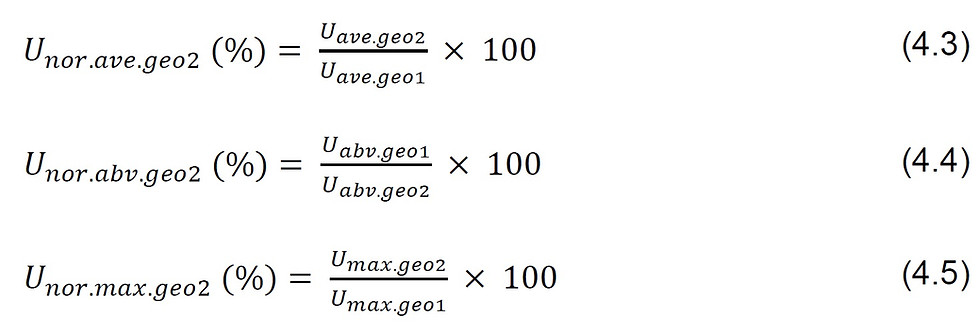
A total of four analyses were undertaken using three zones and criteria, and the purpose of the final analysis (analysis # 4) was to represent 38 building performances in a single graph (Fig. 4.4). Using this representation, architects and wind engineers can understand which building geometry works best/better/worse/worst, compared with other geometries.

Fig. 4.4. Building performance assessment, represented by a single graph
The quantifications of each geometry in percentage are represented in Table 4.1. The results show that downwardly- tapered or concave designs perform better than a baseline cuboid (refer to my PhD for detailed quantifications of the 38 geometries’ performance).
Table. 4.1. Building performance assessment, represented by rankings

Results – Qualitative Analysis
Building performance was also qualitatively analysed by explaining the wind patterns around each building geometry. Fig. 4.5 represents the contours of the wind speed ratios generated by the best (geometry 18), baseline (1) and worst (12) at 1.5 m above ground level.
Downward taper with a convex facade (geometry 18) performed the best, reducing PLW speed ratios because the downward design made the pressure difference between windward and adjacent surfaces relatively high; hence, fast moving winds were pushed away from the building. The convex surface deflected air further due to various angles. Thus, relatively low winds were created around geometry 18 compared to the baseline cuboid.
Upward taper with corner chamfers (geometry 12) worked the worst, increasing PLW speed ratios because the upward taper together with chamfers, reduced the pressure difference between the upwind and side surfaces of the building. Thus, relatively fast winds passed much closer to the building.
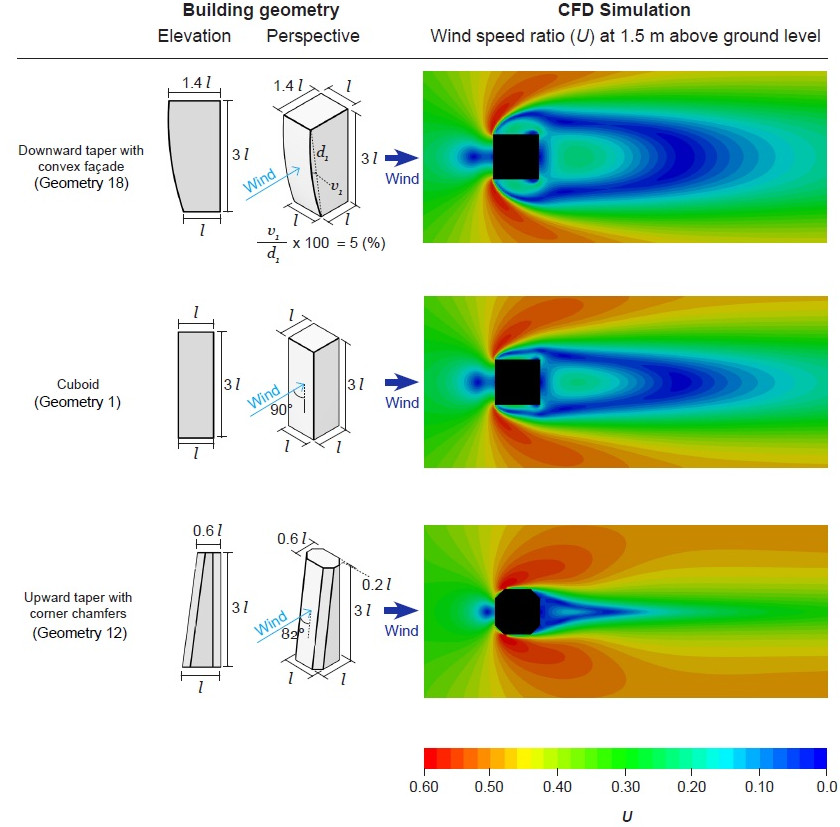
Fig. 4.5. Qualitative analysis – wind pattern analysis at 1.5 m above ground level
The pros and cons of each geometry were explained compared to the baseline cuboid. Table 4.2 provides the descriptions of convex-downward taper and upward taper with chamfers.
Table. 4.2. Qualitative building performance assessment
– Pros. and Cons. of convex-downward taper, compared to the baseline cuboid
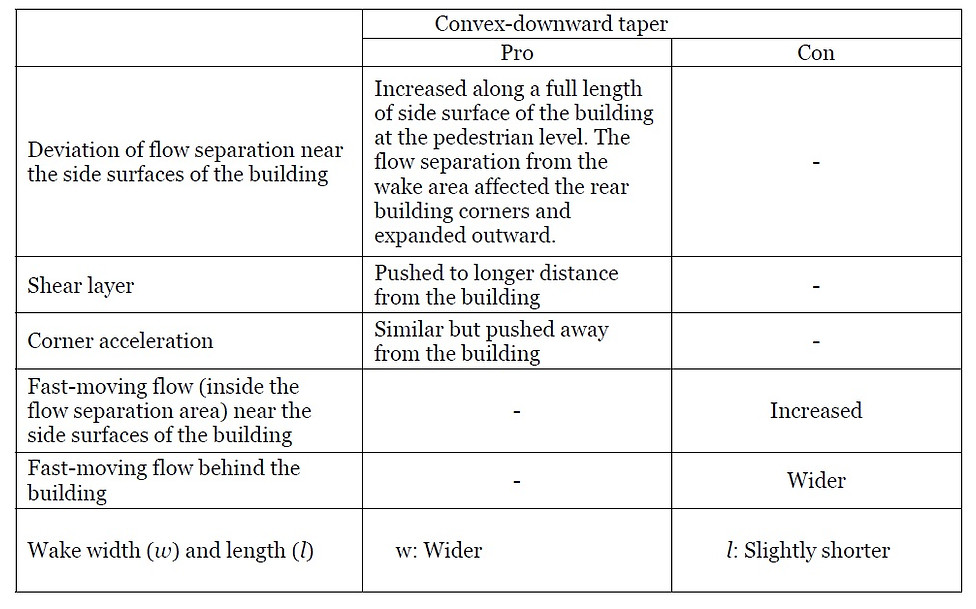
Table. 4.3. Qualitative building performance assessment
– Pros. and Cons. of upward taper with chamfers, compared to the baseline cuboid

London’s Urban Context
The best and worst geometries chosen from the isolated condition were tested together with the baseline cuboid in London’s urban built environment.
Approach and Methodology
The sites of interests were with 200 m -diameters around tall buildings in London, but the built environments were modelled with 700 m -diameters, considering the effects of the surrounding buildings (Fig. 4.6). A total of three sites (two in the City of London and one in Canary Wharf), were modelled in 3D, using Rhino (v.6) [9, 10]. A grid mesh was structured for the simulations (Fig. 4.7).

Fig. 4.6. 3D modelling: London’s built environments with 700 m -diameters.

Fig. 4.7. CFD Simulation grid setup.
Results
Qualitative Analysis – Wind Patterns at the Pedestrian Level
Wind patterns (Fig. 4.8) and streamlines (Fig. 4.9) created by southwestern winds (London’s most prevailing winds) were analysed. Wind comfort was also assessed (Fig. 4.10). The results clearly showed that the best geometry 18 in the isolation performed the worst, and the worst geometry 12 from the isolation worked the best in London’s built environments.

Fig. 4.8. Qualitative analysis – wind pattern analysis at 1.5 m above ground level

Fig. 4.9. Streamlines of winds at 1.5 m above ground level
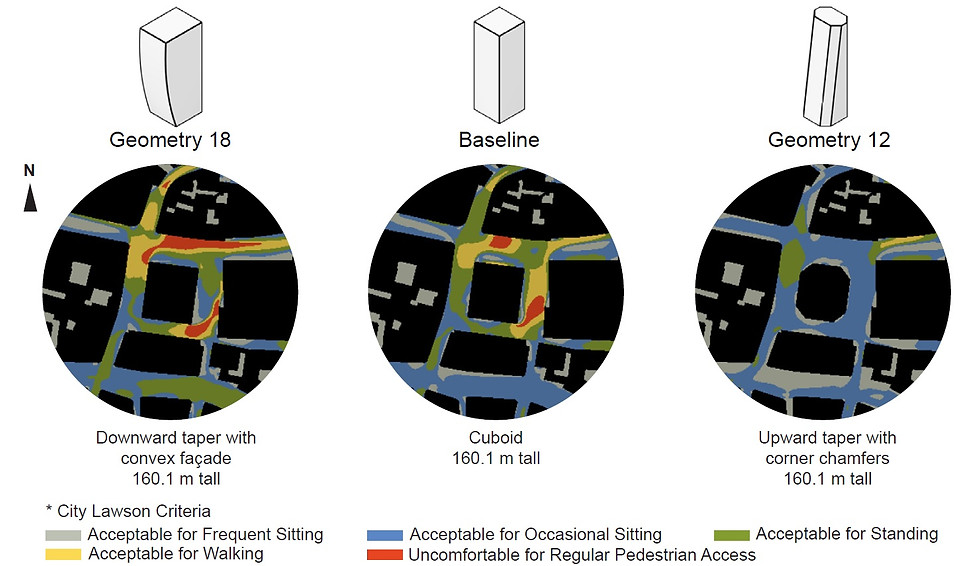
Fig. 4.10. PLW comfort
* Note that the sites shown in Fig. 4.8–10 are 20 Fenchurch Street site in the City of London among the three sites.
In the isolated condition, geometry 18 pushed fast wind further away from the building. However, in London’s urban condition, those high-speed winds could not pass outwards and were deflected from the surrounding buildings. Also, the convex design made the building width wider, and so, the pressure differences increased between the windward and adjacent surfaces. This caused further corner accelerations. Moreover, due to the convex facade, the distances between the target building and the surroundings became irregular, and thus, stronger Venturi effects occurred. Therefore, convex-downward buildings performed the worst in London’s built environments.
Geometry 12 caused relatively low-speed winds to pass close to the building, compared to the baseline and geometry 18. This was because corner chamfers and the shorter widths of the upward taper reduced the pressure difference between the upwind and adjacent surfaces. Also, the upward taper caused less Venturi effect. These helped decrease PLW speeds around the target building in London’s built environments.
The PLW comfort areas for geometries 18, 1 and 12 were quantified in percentages (Fig. 4.11). The graph clearly shows that geometry 12 performed the best, increasing frequent/occasional sitting areas and reducing standing/walking comfort areas and uncomfortable areas. Note that as the threshold wind speeds of frequent/occasional sitting are relatively low with values of 2.5 and 4 m/s, respectively [5] than the other criteria, the larger areas of comfort mean the better building performance. Conversely, as the thresholds of the standing/walking comfort and uncomfortable areas are relatively high as 6, 8 and over 8 m/s, respectively [5], the greater areas of the comfort indicates the worse performance.
Quantitative Analysis – Wind Comfort Area (%) at the Pedestrian Level
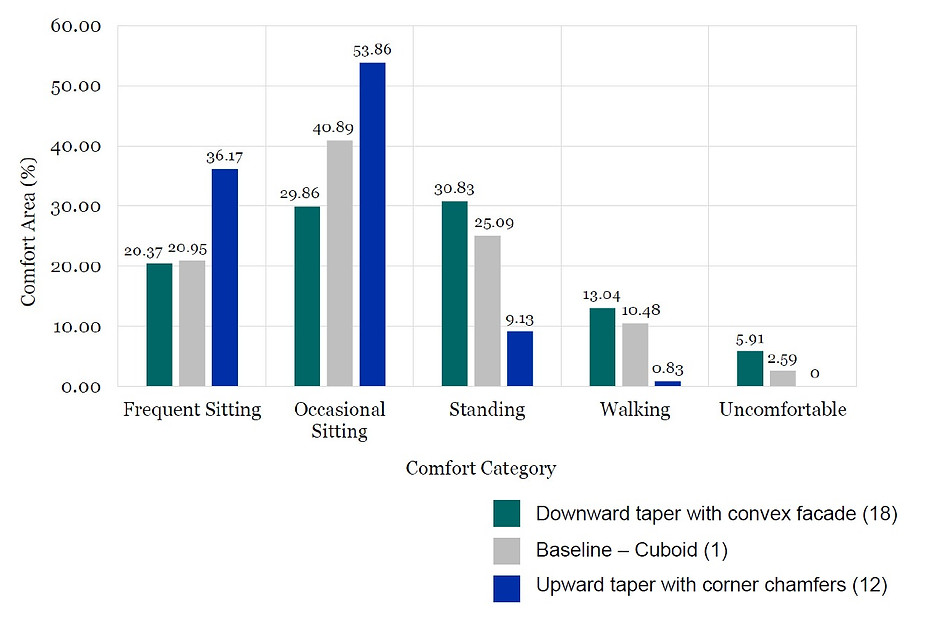
Fig. 4.11. Quantitative analysis - PLW comfort area (%) of geometries 18, 1 and 12 in 160.1 m tall at the same site of Fig. 4.8–10.
Note that this is part of my PhD thesis, "Geometry of Tall Buildings Improving Wind Comfort in London":
[5] City of London and RWDI. “Wind Microclimate Guidelines for Developments in the City of London.” Accessed November 1, 2022.https://www.cityoflondon.gov.uk/assets/Services-Environment/wind-microclimate-guidelines.pdf.
[7] Sources: The data from Council on Tall Buildings and Urban Habitat, “London”;“Digimap,” EDiNA, accessed May 28, 2021, https://digimap.edina.ac.uk/; “3D Warehouse,” SketchUp, accessed May 28, 2021, https://3dwarehouse.sketchup.com/?hl=en.
The sizes of buildings were best estimated with the data from the above.
[8] Kim, Yujin, Hesham Ebrahim, and George Jeronimidis. “The Effects of Geometrical Changes of Tall Buildings on Pedestrian-Level Wind Speeds.” Paper presented at The Eleventh International Conference on Engineering Computational Technology, Montpellier, France, August 23–25, 2022 and published in Topping, B.H.V. and P. Iványi (Editors), Proceedings of the Eleventh International Conference on Engineering Computational Technology, Civil-Comp Press, Edinburgh, UK, Online volume: CCC 2, Paper 2.3, 2022.
https://www.ctresources.info/ccc/paper.html?id=9458.
[9] Rhinoceros. “Rhino.” Version 6. Accessed September 1, 2020.
https://www.rhino3d.com/.
[10] Sources: The data from Council on Tall Buildings and Urban Habitat, “London”;“Digimap,” EDiNA, accessed May 28, 2021, https://digimap.edina.ac.uk/; “3D Warehouse,” SketchUp, accessed May 28, 2021, https://3dwarehouse.sketchup.com/?hl=en.
The sizes of buildings were best estimated with the data from the above.